Finding Carbon Research Project
Territorial Emissions
14%
USA Fossil CO2 emissions (territorial) % of World
Friedlingstein et al. 2023
Fossil CO2 emissions by country (territorial) & World
Friedlingstein et al. 2023
Friedlingstein et al. 2023
In addition to the current focus on fossil CO2 emissions, other interesting data might include sector-specific emissions breakdowns (e.g., transportation, energy production, industry), trends in renewable energy adoption, comparisons of emissions per capita across countries, effectiveness of carbon offset and capture technologies, and policy impacts on emissions reductions. These topics could provide a more comprehensive understanding of the challenges and progress in addressing climate change.
- Shifting Emission Sources: The data shows a notable decline in emissions from bunker fuels, transportation, and buildings, indicating a shift towards cleaner technologies or more efficient practices in these areas.
- Potential for Improvement: Sectors like agriculture and waste show either small reductions or an increase in emissions. These areas could represent opportunities for targeted interventions and improvements in carbon accounting practices.
- Trend Analysis for Policy and Investment: The overall downward trend in emissions is encouraging, but the variation between sectors highlights where policy and investment might be needed to accelerate reductions, such as in energy production or transport, which remain large contributors to greenhouse gas emissions.

In a world divided, the left thrives with motion, streets bustling with vehicles, a testament to humanity's journey. Across the divide, the right hums with the power of creation, where coal, wind, and solar form a trinity of energy, sustaining the vibrant life to the left. This image captures the duality of progress, a silent dialogue between movement and power, each side dependent on the other, yet standing apart, narrating the ongoing tale of human innovation and environmental consciousness.
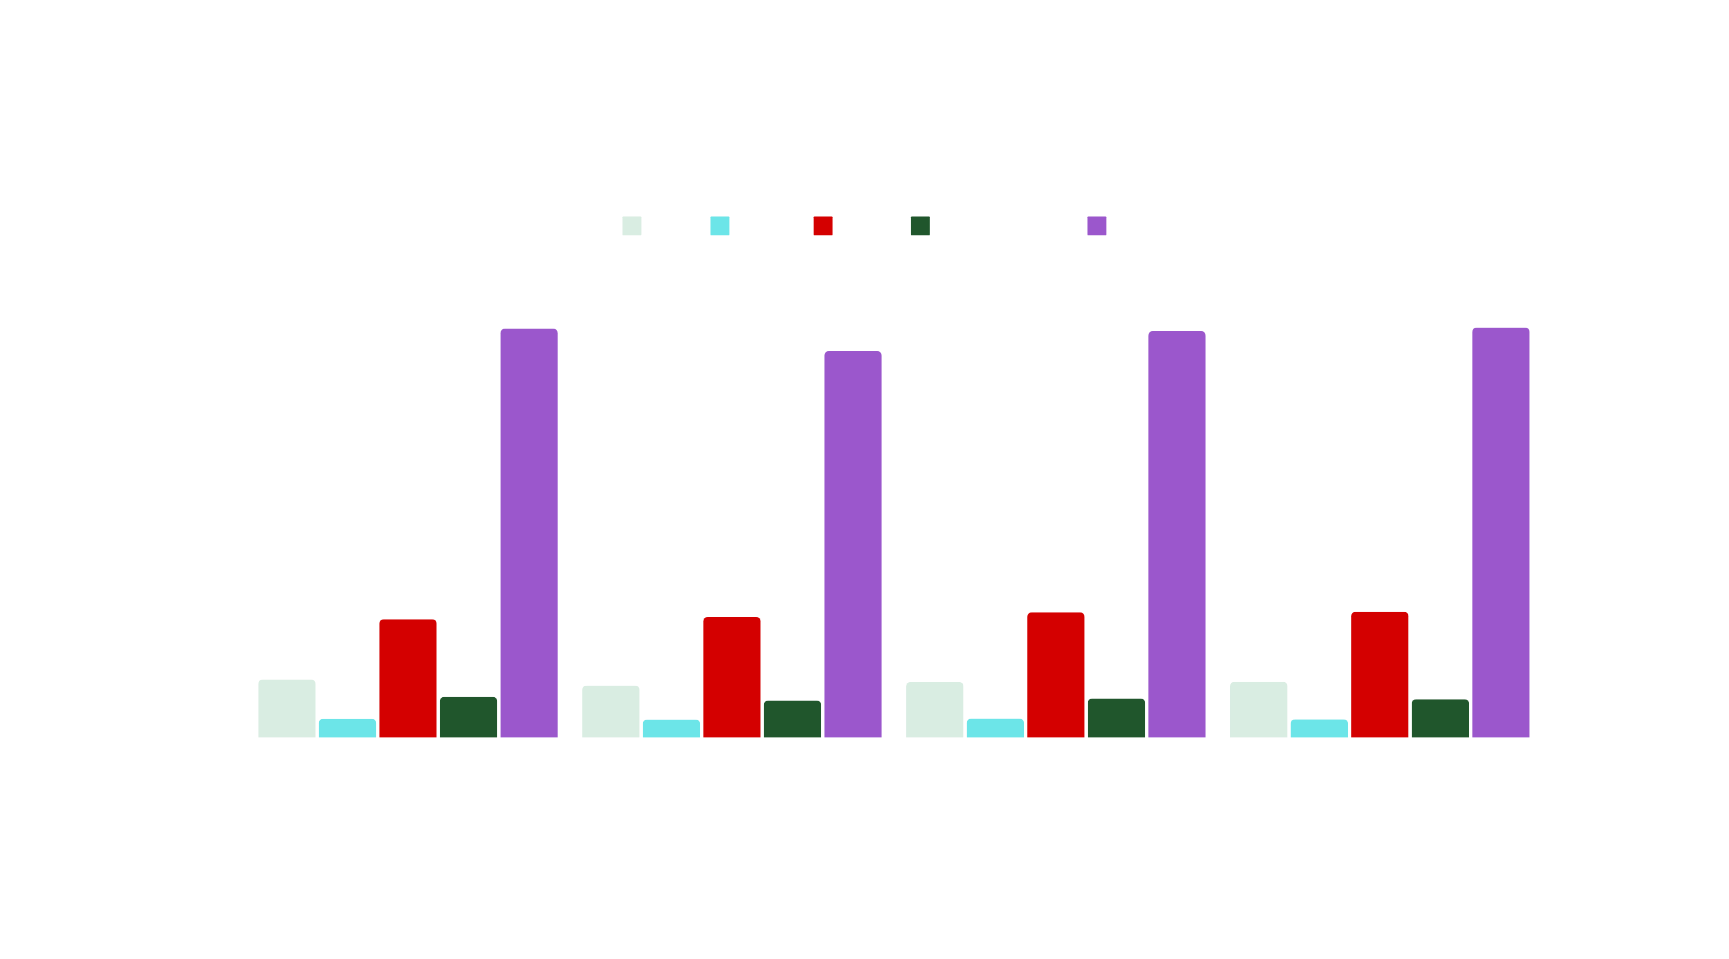
% of 3 Year Avg Total | 3 Year Shrinkage | Sector |
31.1% | 1.6% | Greenhouse gas emissions from electricity and heat |
16.1% | 4.7% | Greenhouse gas emissions from transport |
12.4% | 0.1% | Greenhouse gas emissions from manufacturing and construction |
11.6% | -0.4% | Greenhouse gas emissions from agriculture |
6.7% | 1.0% | Fugitive emissions of greenhouse gases from energy production |
6.1% | -2.9% | Greenhouse gas emissions from industry |
6.1% | 1.9% | Greenhouse gas emissions from buildings |
3.2% | -1.4% | Greenhouse gas emissions from waste |
3.1% | -3.3% | Greenhouse gas emissions from land use change and forestry |
2.4% | 10.0% | Greenhouse gas emissions from bunker fuels |
1.2% | 3.9% | Greenhouse gas emissions from other fuel combustion |
Friedlingstein et al. 2023
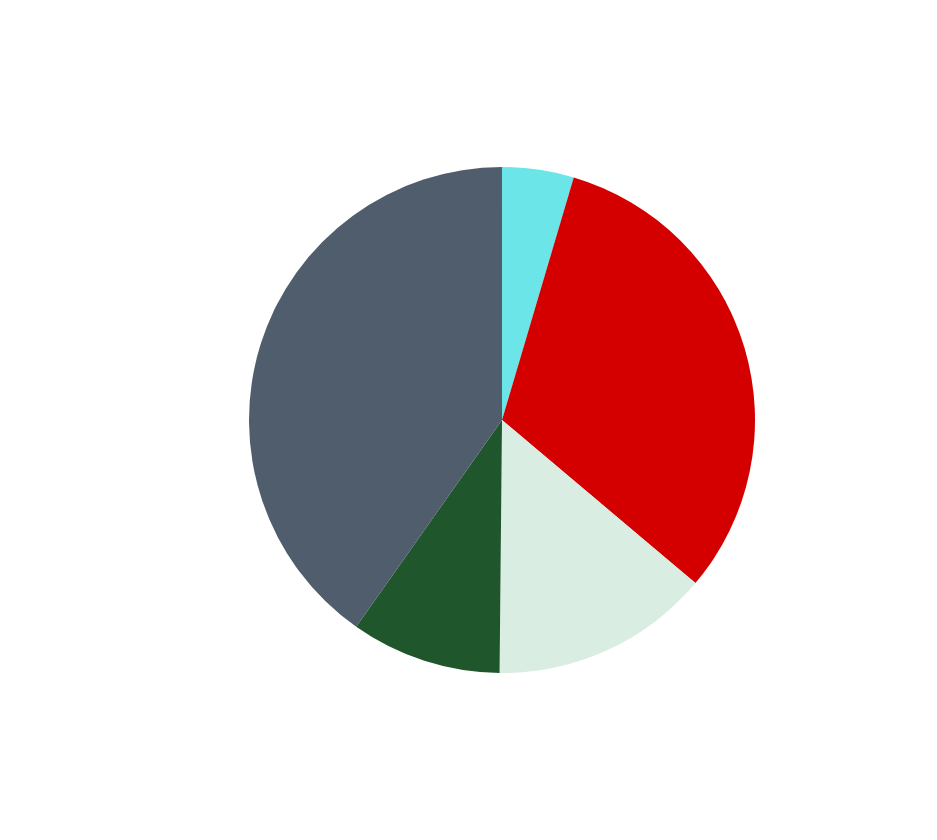
Transport
- 16.1% of total Emissions
- 4.7% shrinkage in CO2 2018 - 2020

Whose counting?
Chilton Bradley EnterPrise
Welcome to the Family